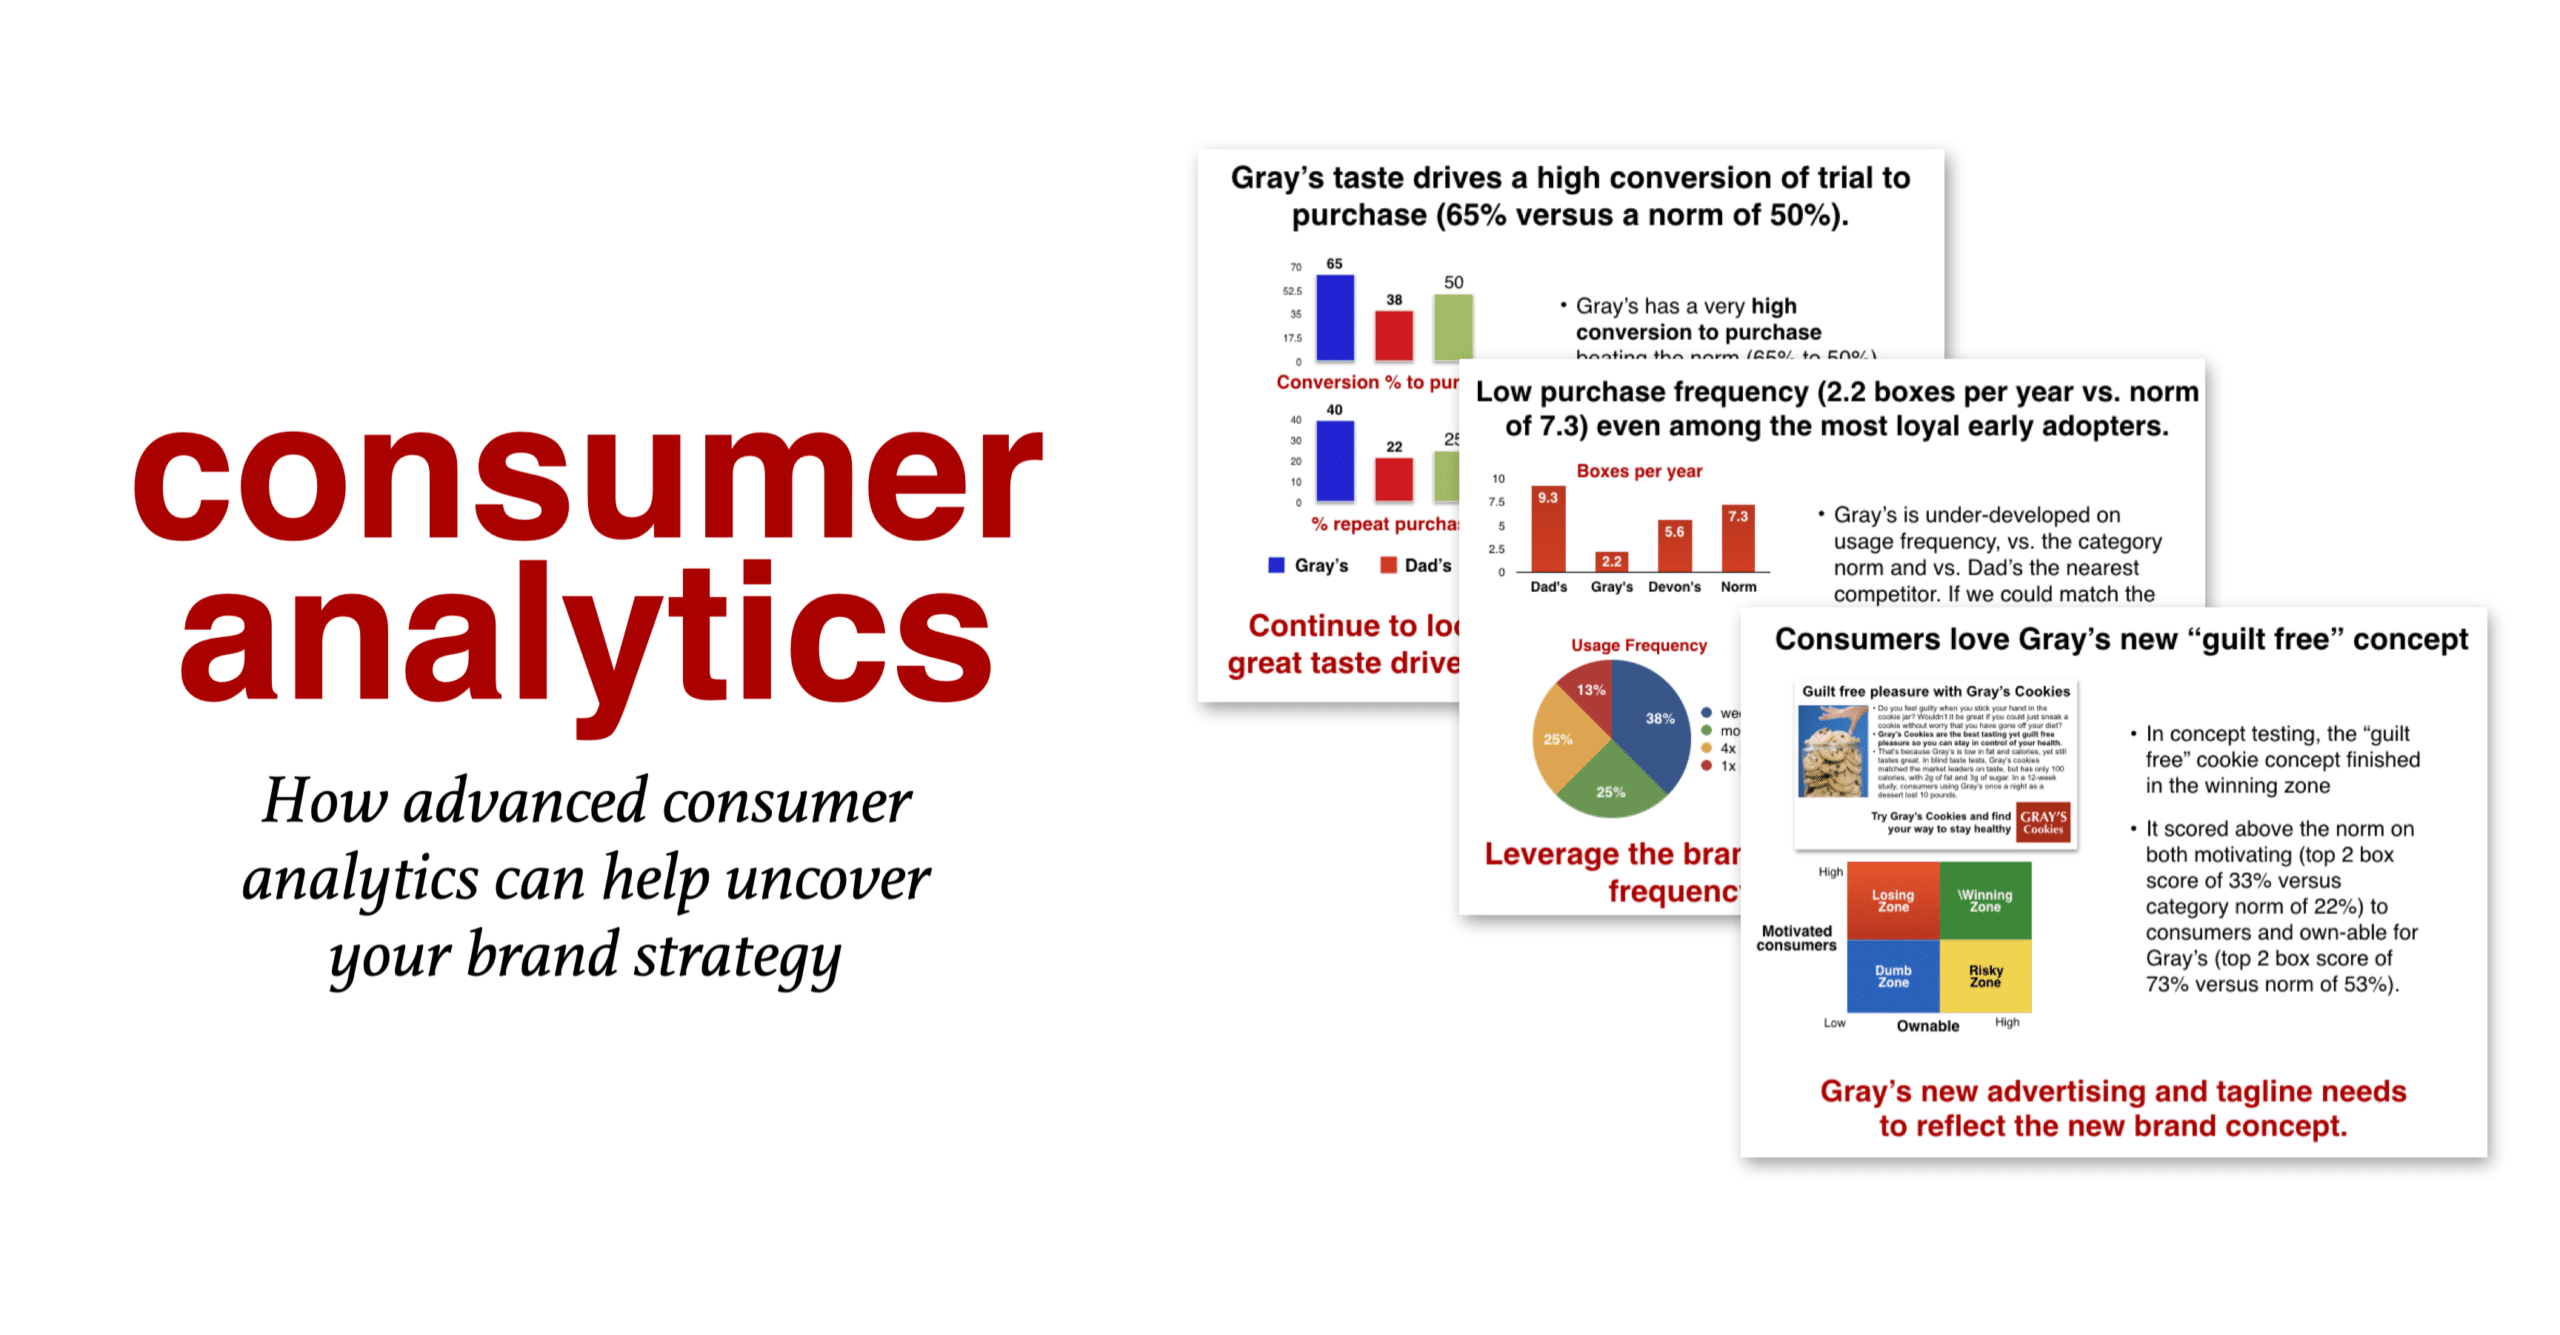
In today’s highly competitive marketplace, brands need to use consumer analytics to uncover the unique situation and circumstances that will help uncover their brand strategy. The one-size-fits-all approach no longer suffices. Instead, at the heart of your deep-dive business are the consumer analytics that include consumer tracking data and the marketing funnel analysis help tell a story of where your brand stands on our brand love curve. From there, your consumer analysis can guide what strategies and tactics you should be focusing on to drive your brand’s growth.
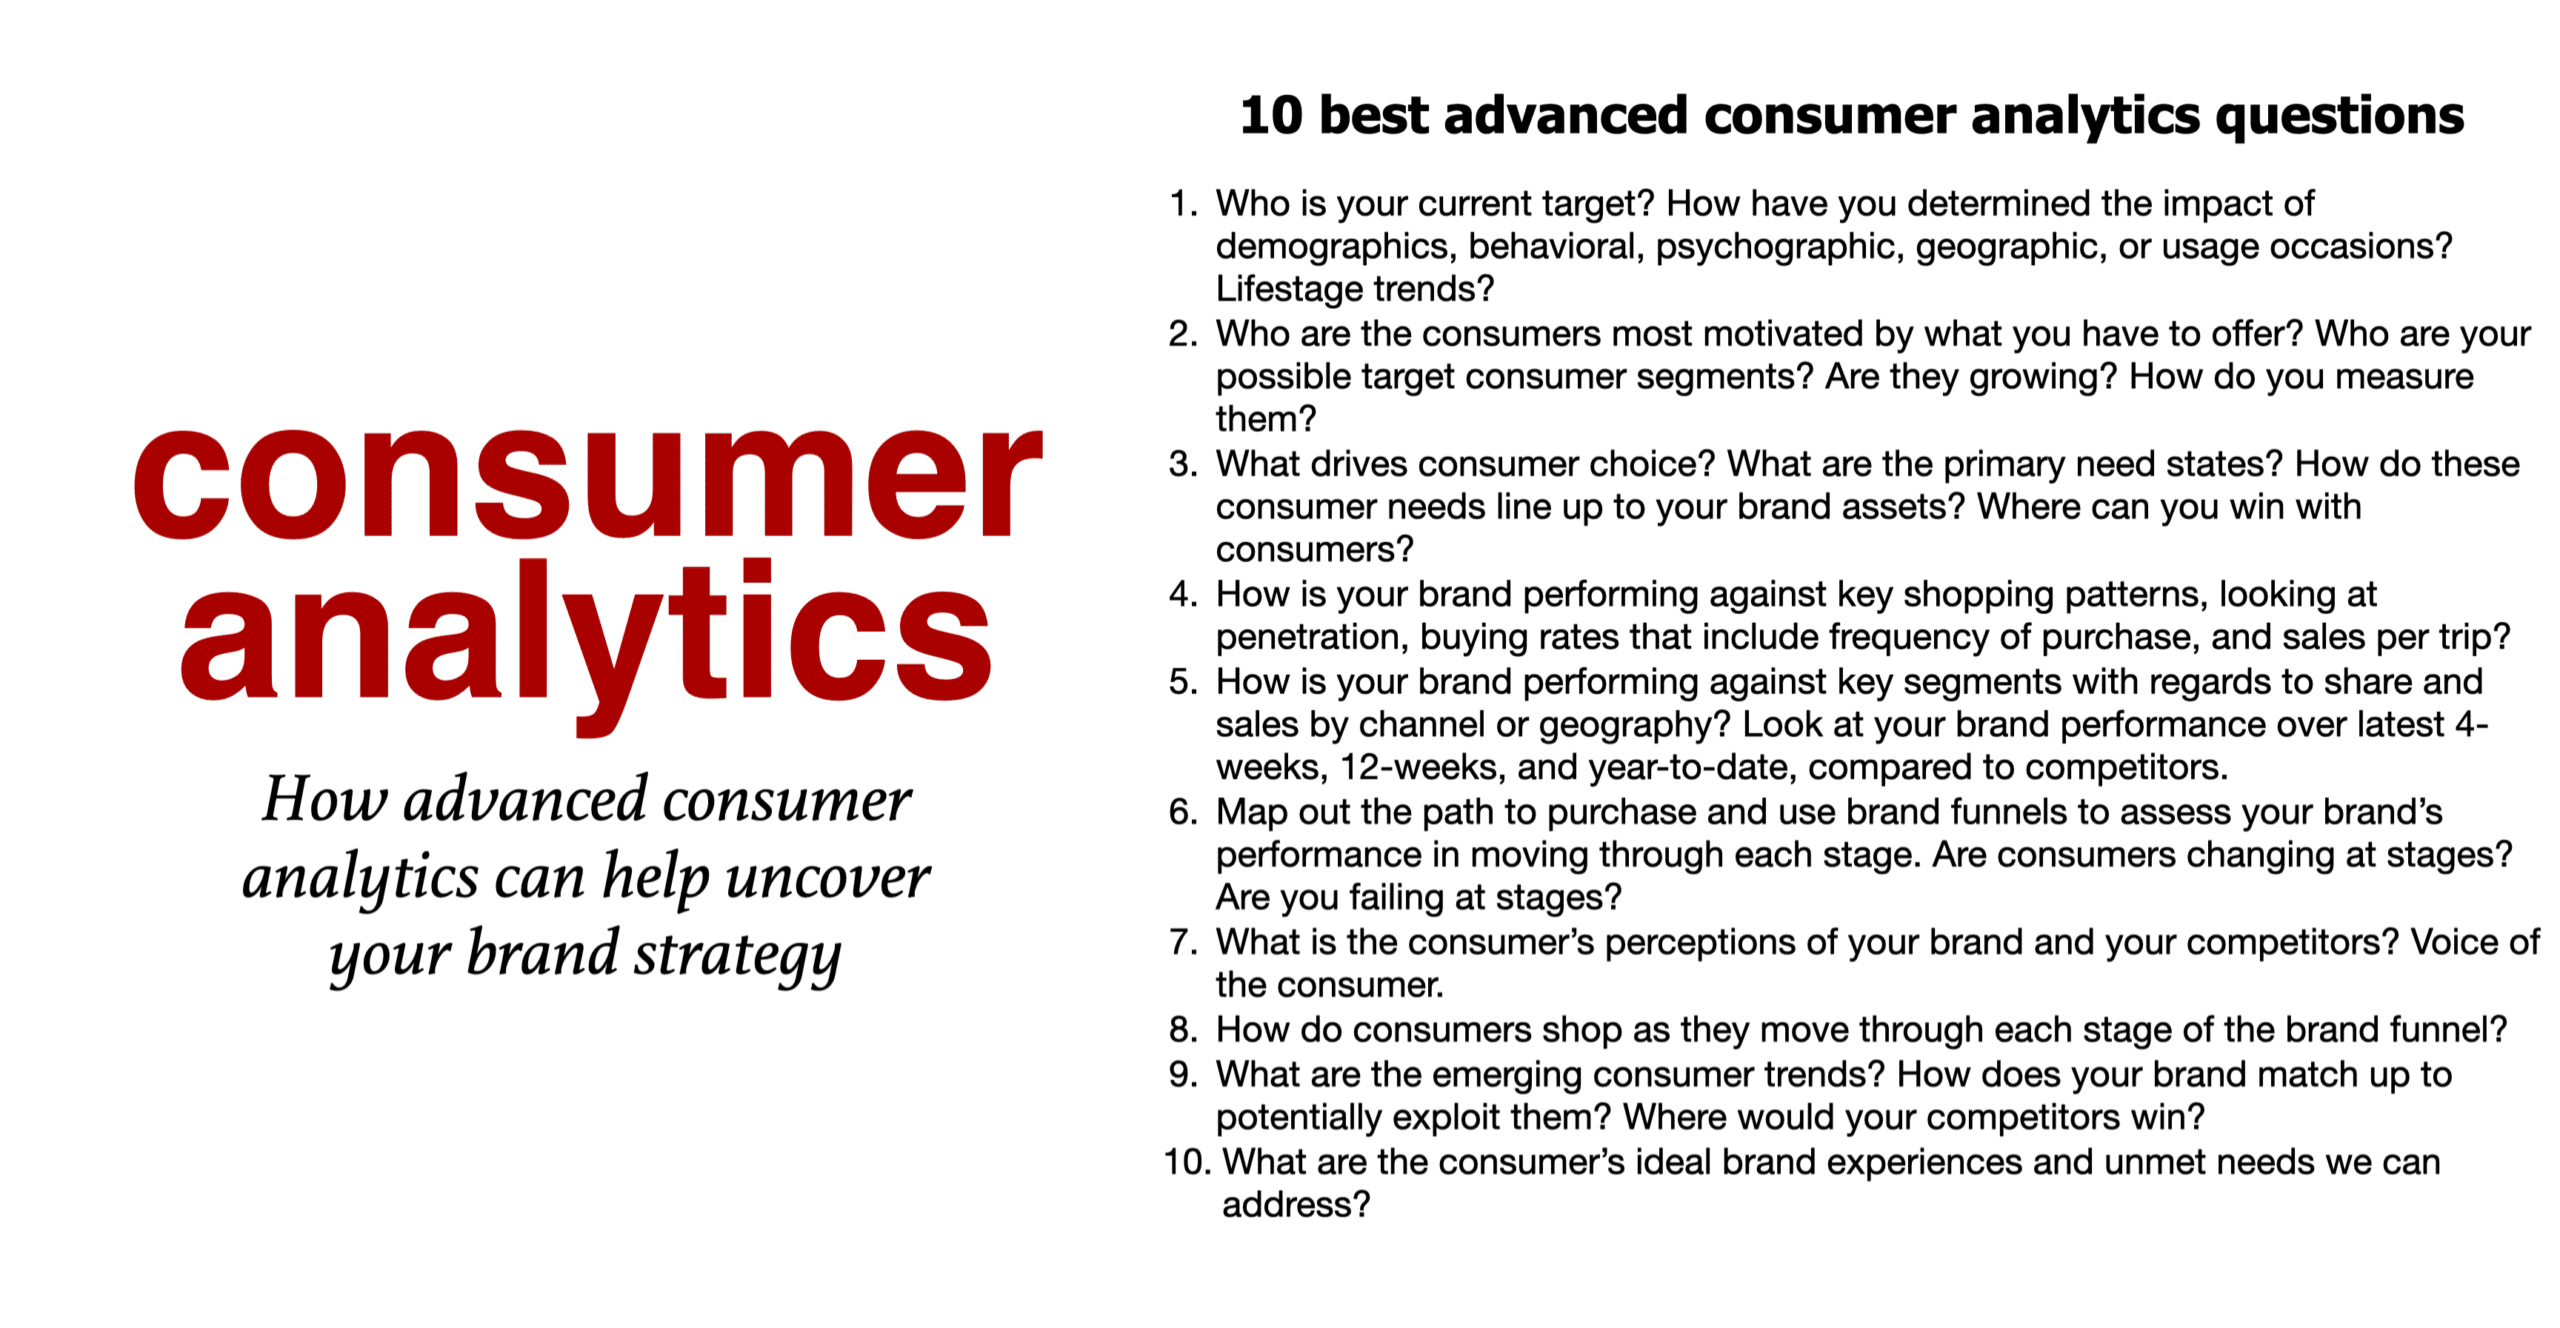
Our best consumer analytics questions
Understanding your audience is the cornerstone of success. With consumer analytics, you can delve beyond demographics to discover behavioral patterns, life stage trends, and geographical preferences. Are you tuned in to who resonates most with your offerings, or how your brand stands against competitors?
By mapping the consumer’s journey and listening to their voice, you not only identify gaps but also foresee emerging trends. Dive into these 10 key questions, leverage analytics, and position your brand for a brighter future. We’ll go through them in this post.
To illustrate, click on the consumer analytics questions above to zoom in.
Understanding the target market
Consumer analytics questions to be asking about the target market
1️⃣ First, who is your current target? How have you determined demographics, behavioral or psychographic, geographic, and usage occasion? Generational trends?
2️⃣ Then, who are the consumers most motivated by what you have to offer? Who are your possible target consumer segments? Are they growing? How do you measure?
To illustrate, click on the consumer analytics diagram above to zoom in.
There are various ways to divide up the market to identify the most motivated possible audience. Here are three main ways to segment the market:
Consumer profiling:
First, you can use demographics is one of the easiest ways to segment. While some resist demographics, you will eventually have to put someone in the ad and likely buy media using age. Then, add in socioeconomic and geographic elements and how they shop. Choose to focus on either current customers or new customers, but never both at the same time. Trying to drive penetration and usage simultaneously will drain your resources. These are two dramatically different targets needing two different messages, two media types, and potentially two product offerings.
Consumer behavior:
Then, you can divide the market based on consumer need states, purchase occasions, life stages, or life moments. You can also divide the market based on purchase behavior, perceptions, or beliefs.
Consumer psychographics:
Finally, you can use Psychographics to look at commonly shared behaviors, such as the consumer’s shared lifestyle, personality, values, or attitudes.
Segmentation forces you to focus.
Please do not spend tons of money on a segmentation study and then try to figure out how to go after each segment with a completely different brand message. I have seen marketers do this, and it is borderline crazy. That is not the right way to use these studies. A brand can only ever have one reputation.
While this shows 12 different ways to segment, a good starting point is to use a combination of 3 or 4 segmentation elements to narrow your target. The choice depends on the category.
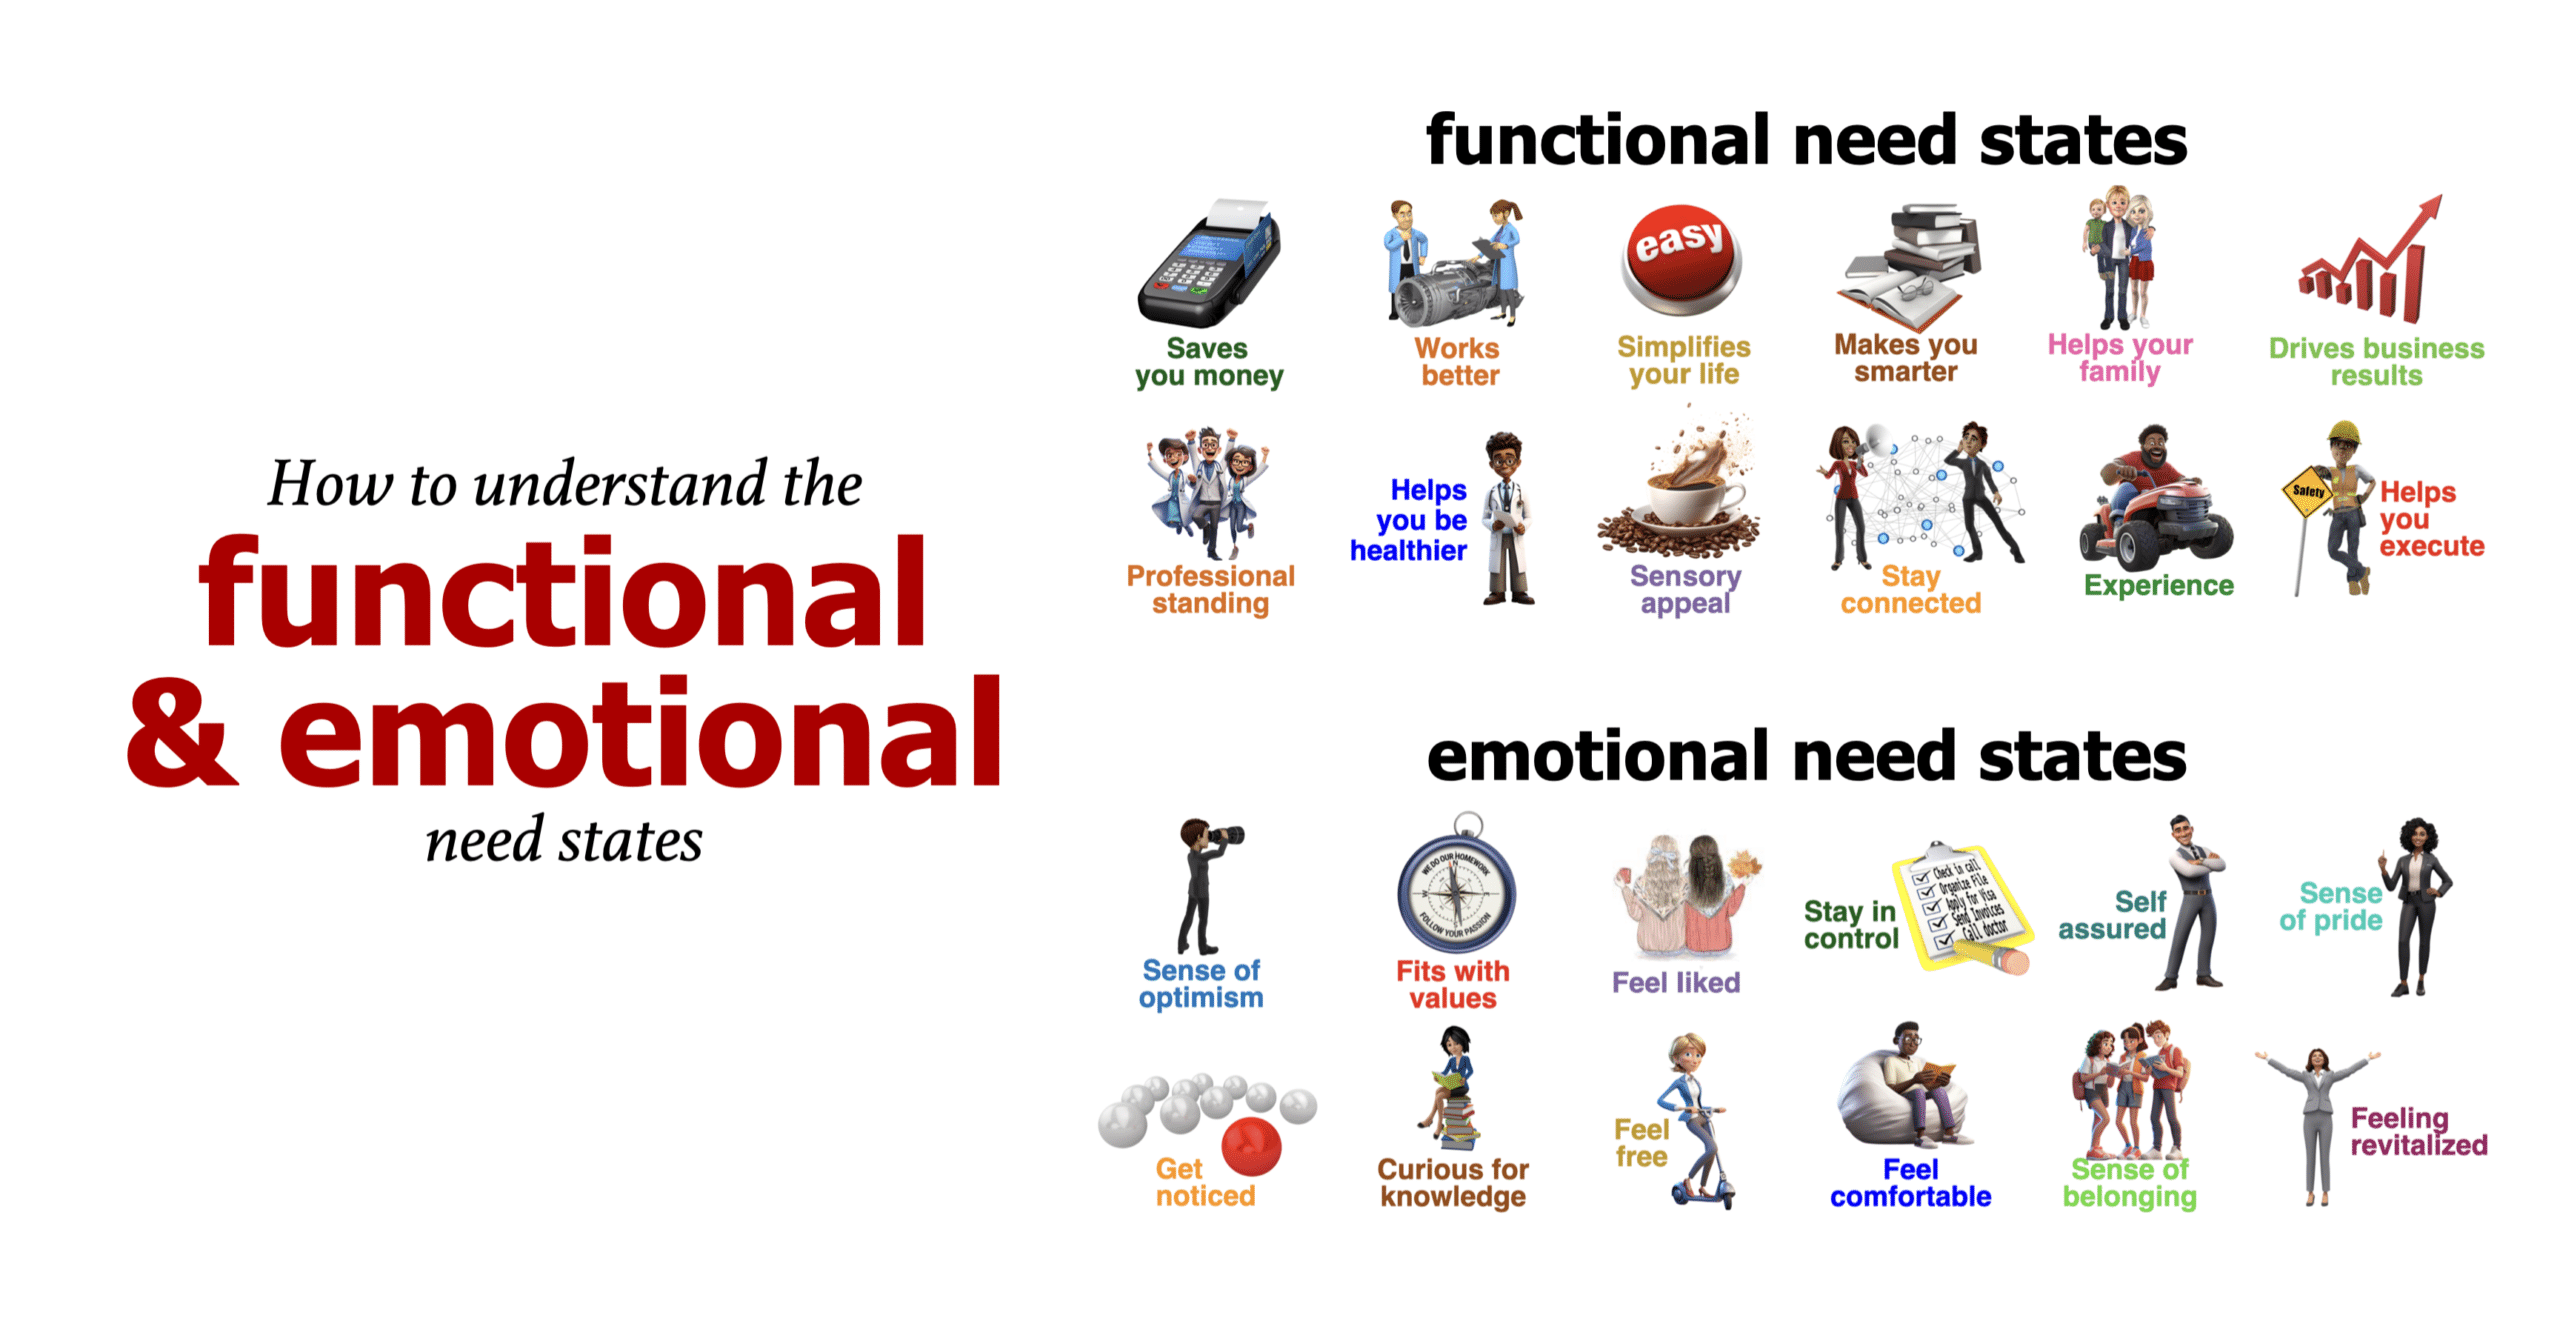
Consumer analytics questions to be asking about the functional and emotional need states
3️⃣ Next, what drives consumer choice? What are the primary need states? How do these consumer needs line up with your brand assets? Where can you win with consumers?
How to use consumer tracking data
Consumer analytics questions to be asking about consumer tracking to help uncover the patterns of penetration and frequency
4️⃣ How is your brand performing against key segments about shopping patterns, looking at penetration, buying rates that include frequency of purchase, and sales per trip?
Tracking or household panel data helps you understand what’s going on in the marketplace and will match up to what’s happening at the store level. In terms of brand strategy, you are either trying to get more people to use your brand (drive penetration) or try to change the way they use your brand (drive purchase frequency). This tool uncovers the consumption data; then you need to put a story to that data.
To illustrate, click on the consumer analytics diagram above to zoom in.
A: Penetration
First, the percentage of households who purchased your brand product at least once during a measured period.
B: Buying rate or sales per buyer
The total amount of product purchased by the average buying household over an entire analysis period, expressed in dollars, units, or equivalent volume.
C: Purchase frequency or trips per buyer
The number of times the average buying household purchases your product over a time period (usually one year).
D: Purchase size or sales per trip
Finally, the purchase size is the average amount of product purchased on a single shopping trip by your average buyer. It can be calculated in dollars, units, or equivalent volume.
Market Share Data
Consumer analytics questions to be asking about market share performance
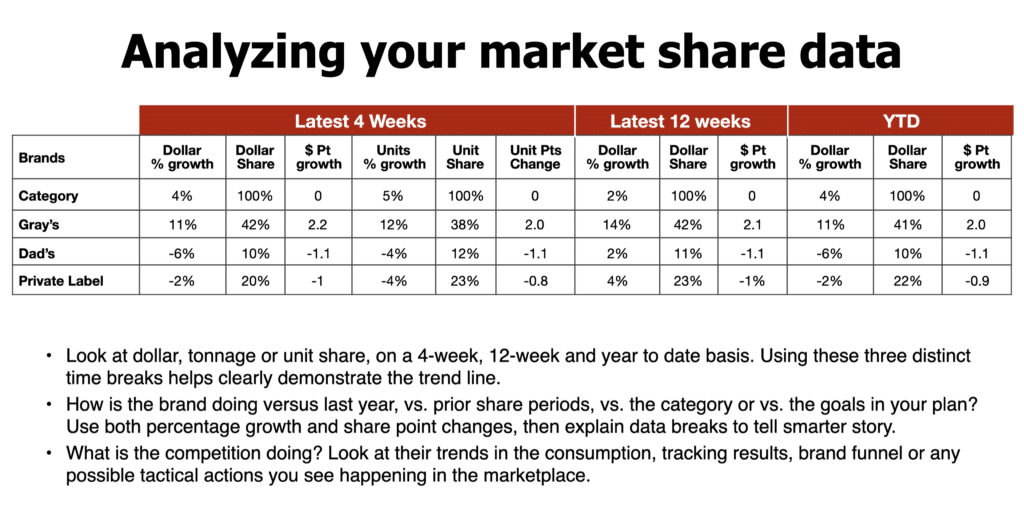
5️⃣ How is your brand performing against key segments with regards to share and sales by channel or geography? In addition, look at your brand performance over latest 4 weeks, 12 weeks, and year to date, compared to competitors.
To illustrate, click on the consumer analytics diagram above to zoom in.
Temporal Trend Triad:
Break down market share in terms of dollars, tonnage, and units across three pivotal timeframes: 4-week, 12-week, and year-to-date. This trio lens unveils the evolving story of your brand’s trajectory.
Benchmark Battles:
Measure your brand’s might! How does it fare compared to last year, previous share periods, or against the category’s giants? Align it with the milestones in your blueprint, blending both percentage growth and share point shifts.
The Data Narrator:
Beyond mere numbers, interpret anomalies in data to craft a compelling narrative. Let’s tell a smarter story by decoding the intricate dance between percentage growth and share point swings.
Rivals’ Rundown:
What’s brewing in the competitor’s camp? Analyze their consumption trends, tracking outcomes, brand funnel dynamics, and any tactical maneuvers unfolding in the market arena. Stay one step ahead by knowing their moves!
Through this engaging lens, market share analysis becomes not just a numbers game but a strategic treasure trove. Dive in!
How to use marketing funnel data
Consumer analytics questions to be asking about marketing funnels
6️⃣ Next, map out the path to purchase and use brand funnels to assess your brand’s performance in moving through each stage. Are consumers changing at stages? Are you failing at stages?
7️⃣ What are the consumer’s perceptions of your brand and your competitors? Voice of the consumer.
Using marketing funnel? Measure these six steps:
Every brand leader worth their salt knows the lifeline of their brand: the marketing funnel. It’s your brand’s health checkup, comparable to knowing your own cholesterol levels or blood pressure.
- Awareness – Are people even aware of your brand’s heartbeat in the vast market jungle?
- Familiarity – Beyond just name recognition, do they actually know your brand?
- Consideration – Among the noise, are they leaning towards giving you a nod?
- Purchase – Cash meets counter. They’re buying in.
- Repeat – The encore. They’re back for round two, three, or ten.
- Loyalty – They’re not just customers; they’re evangelists.
If you’re short on time or resources, zero in on Awareness, Purchase, and Repeat. But here’s the kicker: Don’t get lost in just the individual metrics. The magic is in understanding the shifts and transitions – how effectively are you moving consumers from mere awareness to full-blown loyalty?
Now, for the piece of the puzzle: The brand love curve.
A strong, wide funnel means you’re not just in the game, you’re leading it. It’s a testament to how well your brand resonates with the consumers. In the world of consumer analytics, understanding your marketing funnel is not a luxury; it’s a necessity.
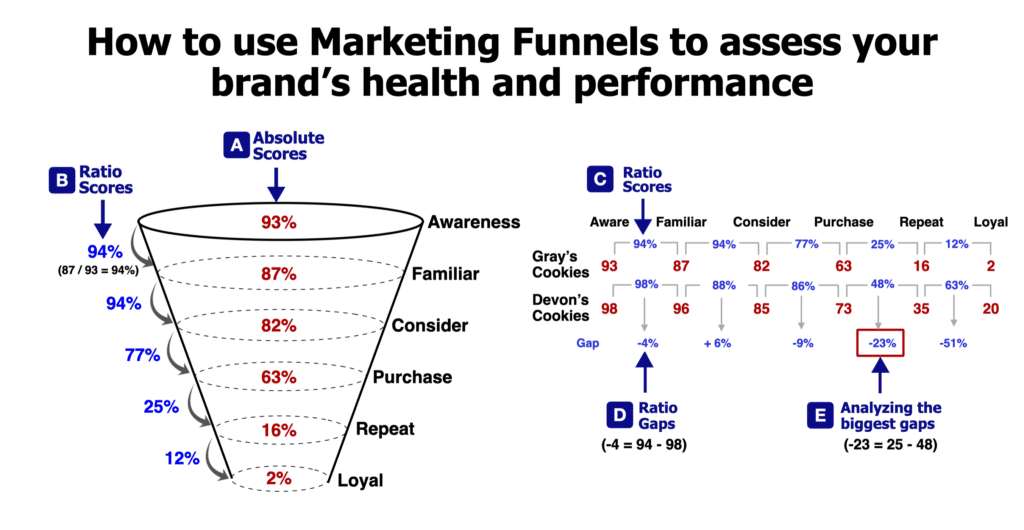
To illustrate, click on the consumer analytics diagram that shows the marketing funnel.
A: Absolute marketing funnel scores
First, on the sales funnel chart above, the first thing to do is look at the absolute marketing funnel scores—93% awareness, and 87% familiar. There are many types of comparisons you can do, whether you compare to last year, competitors, or category norms.
B: Marketing funnel ratios
Then, look at the sales funnel ratios, which is the percentage score for how well your brand can convert consumers from one stage of their purchase journey to the next. Divide the absolute score by the above score on the marketing funnel to create ratios. In the example above, divide the familiar score of 87% by the awareness score of 93% to determine a conversion ratio of 94%. This means 94% of aware consumers are familiar.
C: Compariing marketing funnel ratio scores
Next, on the second chart to the right, lay out the absolute scores and ratios horizontally to allow a comparison. You will notice these are the same scores as “A” and “B” in the previous chart. The crucial numbers for Gray’s Cookies are the ratios of 94%, 94%, 77%, 25%, and 12% at the top of the chart. Then, bring in a close competitor (Devon’s) with their absolute and ratio scores to allow a direct comparison.
D: Creating marketing funnel ratio gaps
Above, find the ratio gaps by subtracting the competitor’s ratio scores from your brand’s ratio scores. In the example, the first ratio gap is -4% ratio gap (94% – 98%). Clearly, this means Devon’s does a 7% better job in converting consumers from awareness to familiar than Gray’s Cookies.
Next, as you create ratio gaps along the bottom, you can see where your ratio is either stronger or weaker than the comparison brand. Essentially, these ratios show how well you can move your consumers along their purchase journey.
E: Analyzing the biggest gaps
Finally, start analyzing the significant gaps between the two brands and tell a strategic story to explain each gap. Looking at the example, you can see Gray’s and Devon’s have similar scores at the top part of the funnel, but Gray’s starts to show real weakness (-23% and -51% gap) as consumers move along their purchase journey from repeat to loyalty. Then, address and fix these sales funnel gaps with your brand plan.
Brand Love Curve
Matching consumer analysis to the brand love curve
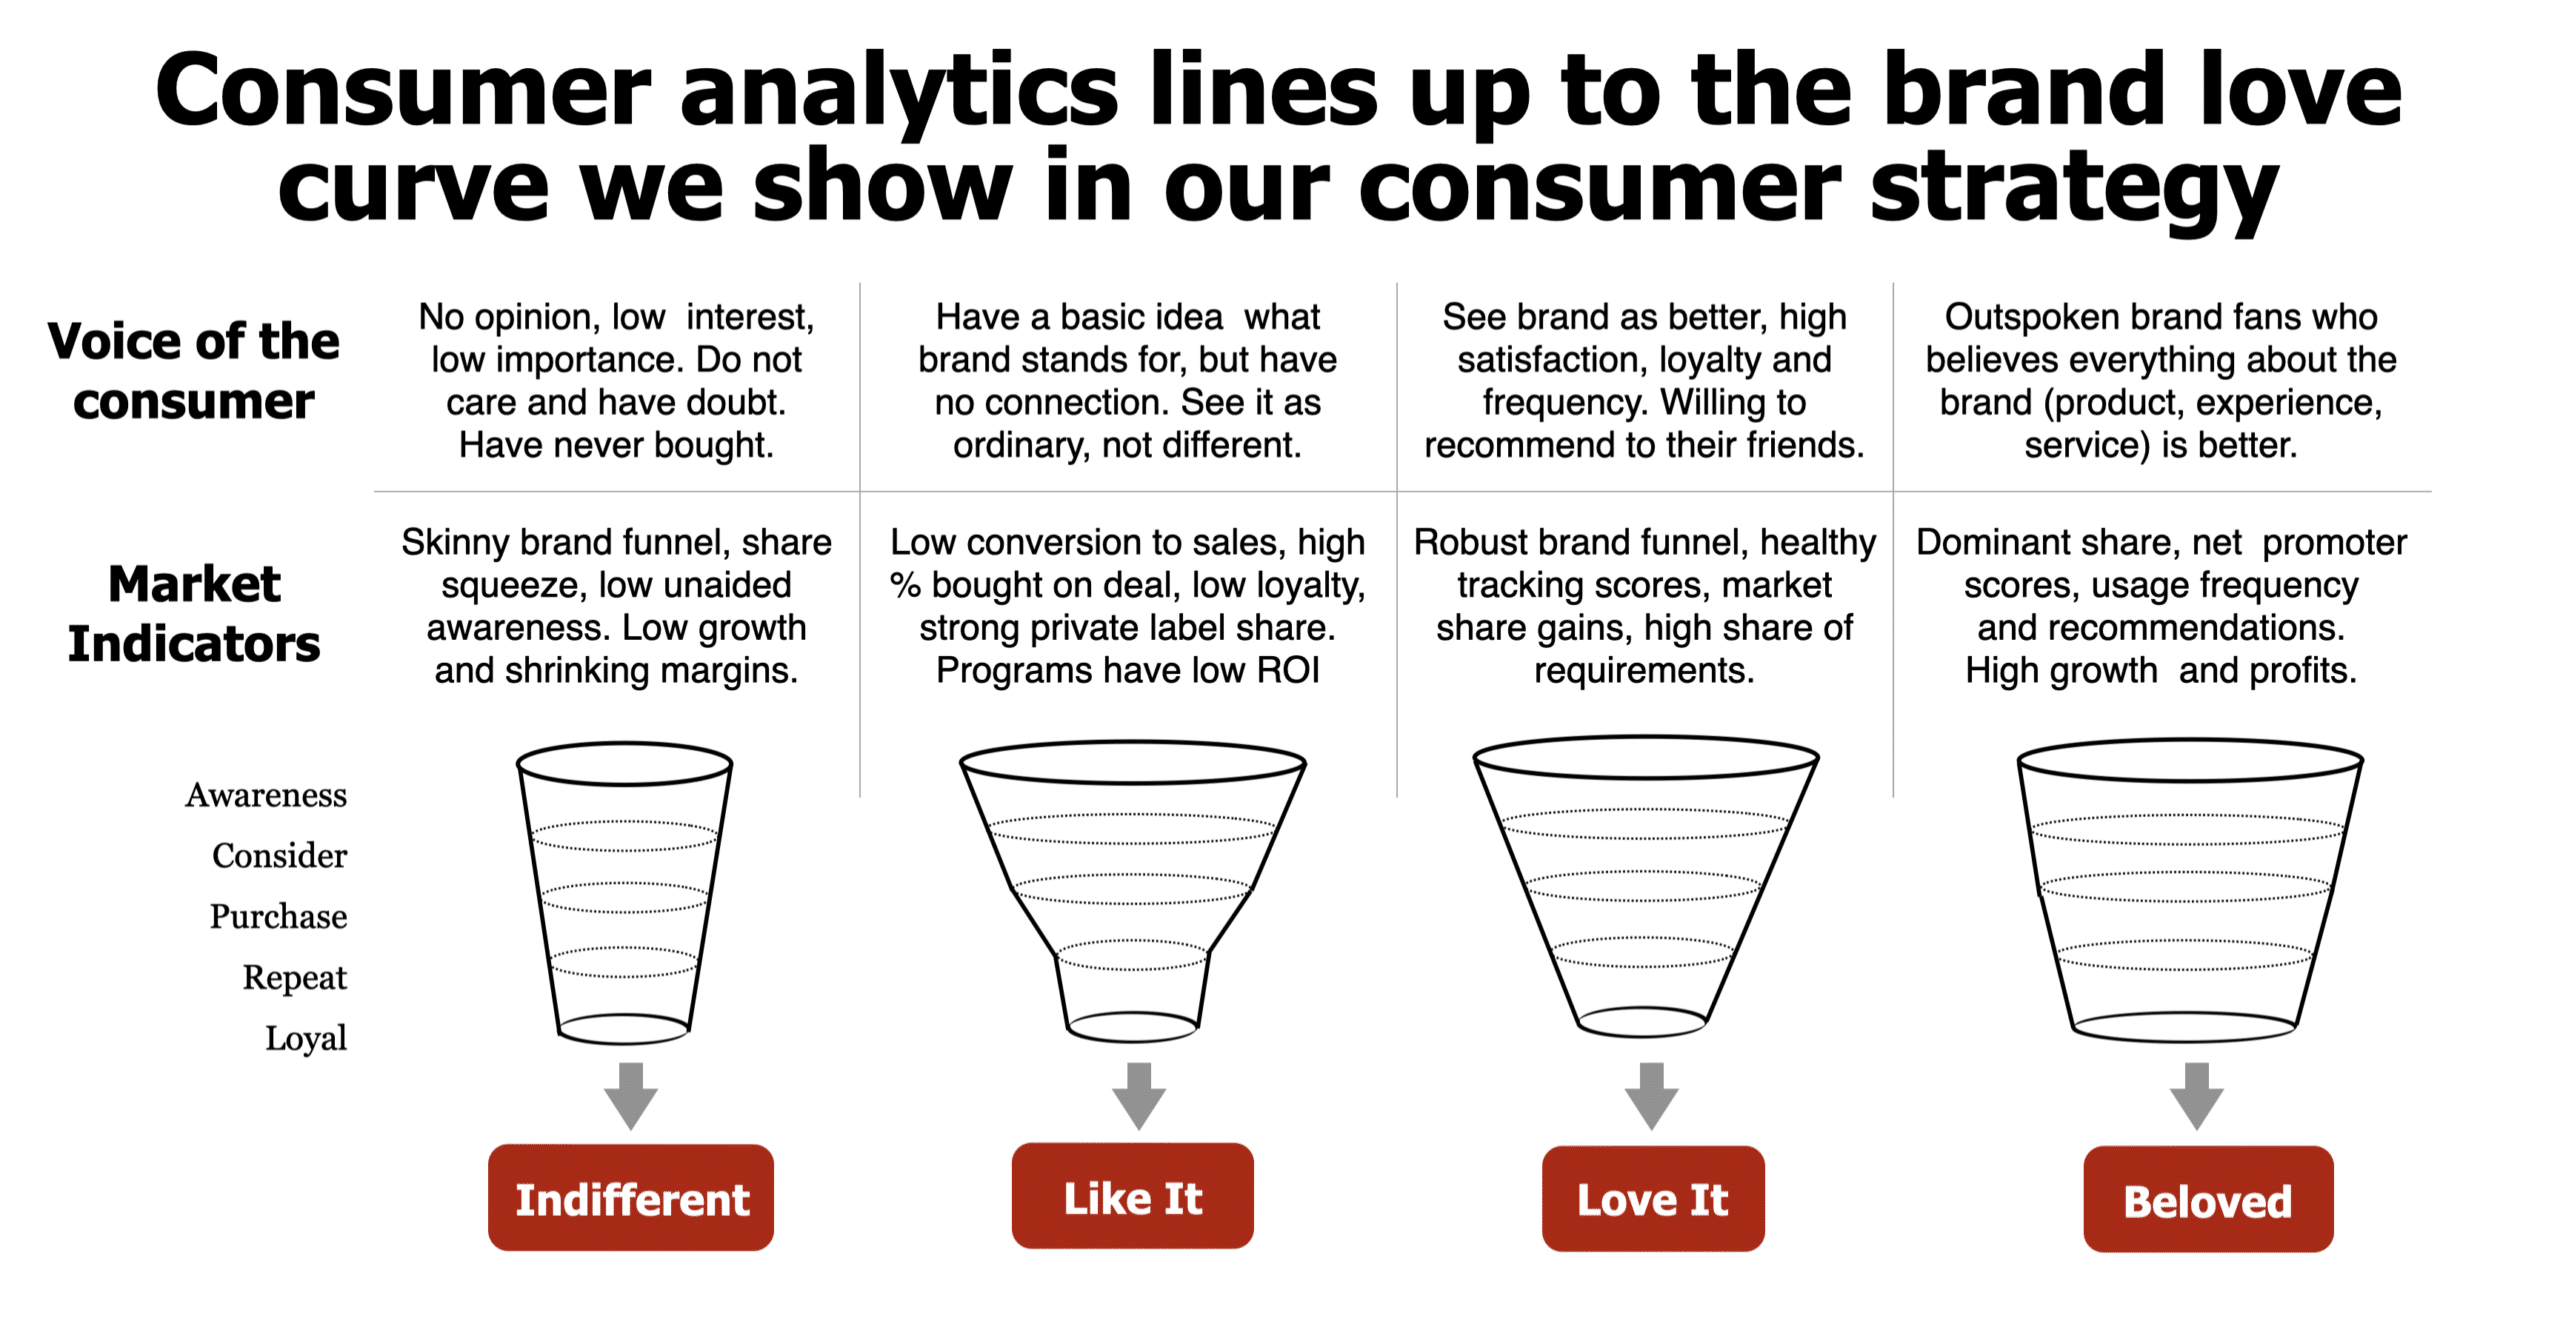
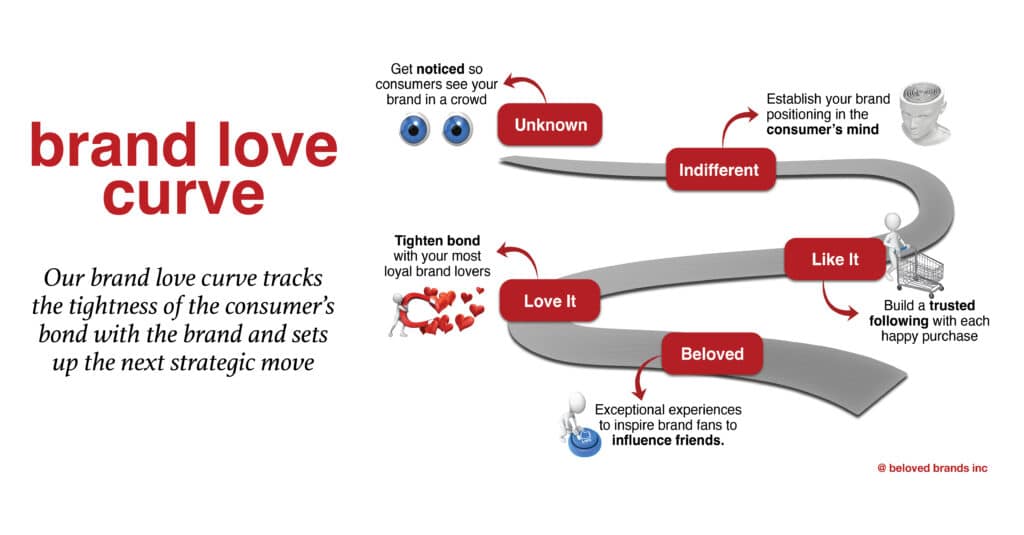
You can begin using your consumer tracking, marketing funnel, market share, and the voice of the consumer to help explain where your brand sits on the brand love curve.
To illustrate, click on the consumer analytics diagram that shows the marketing funnel.
How to use consumer analytics to uncover where the brand sits on our brand love curve
- First, Indifferent brands have skinny funnels, starting with inferior awareness scores. Consumers have little to no opinion. Concerning performance, you will see low sales and poor margins. Your brand plan for indifferent brands should increase awareness and consideration to kickstart the funnel.
- Then, at the like it stage have funnels that are solid at the top but quickly narrow at the purchase stage. Consumers see these brands as ordinary and purchase only on a deal. When they are not advertised or on sale, sales fall off dramatically. These brands need to close potential leaks to build a loyal following behind happy experiences.
- Next, the love it brands have a robust funnel but may have a smaller leak at loyal. They have stronger growth and margins. Look for ways to feed the love and turn repeat purchases into a ritual or routine.
- Finally, beloved brands have the most robust brand funnels and positive consumer views. These brands should continuously track their funnel and attack any weaknesses before competitors exploit them. Also, it is time to leverage that brand love to influence others.
Mapping every stage of the consumer journey
8️⃣ Next, how do consumers shop as they move through each stage of the brand funnel?
9️⃣ What are the emerging consumer trends? How does your brand match up to potentially exploit them? Where would your competitors win?
🔟 Finally, what are the consumer’s ideal brand experiences and unmet needs we can address?
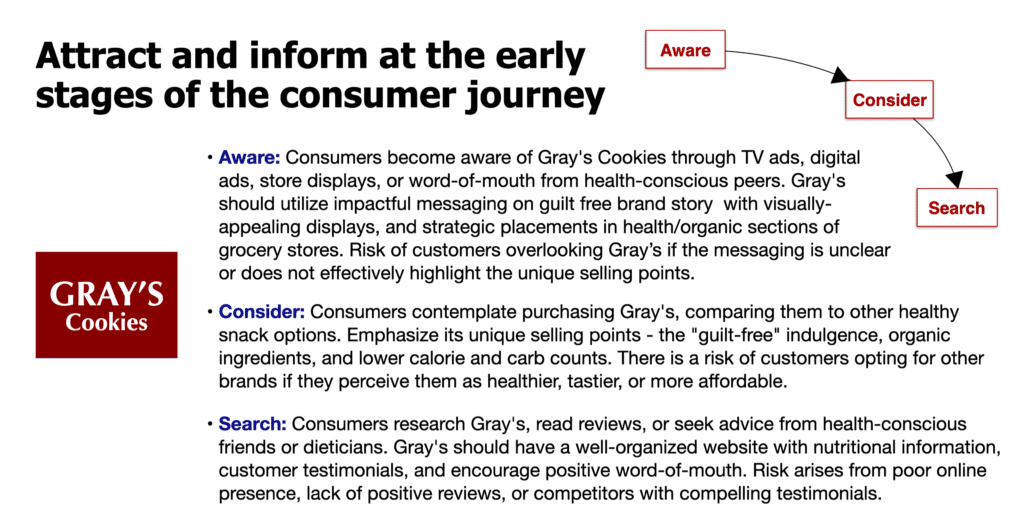
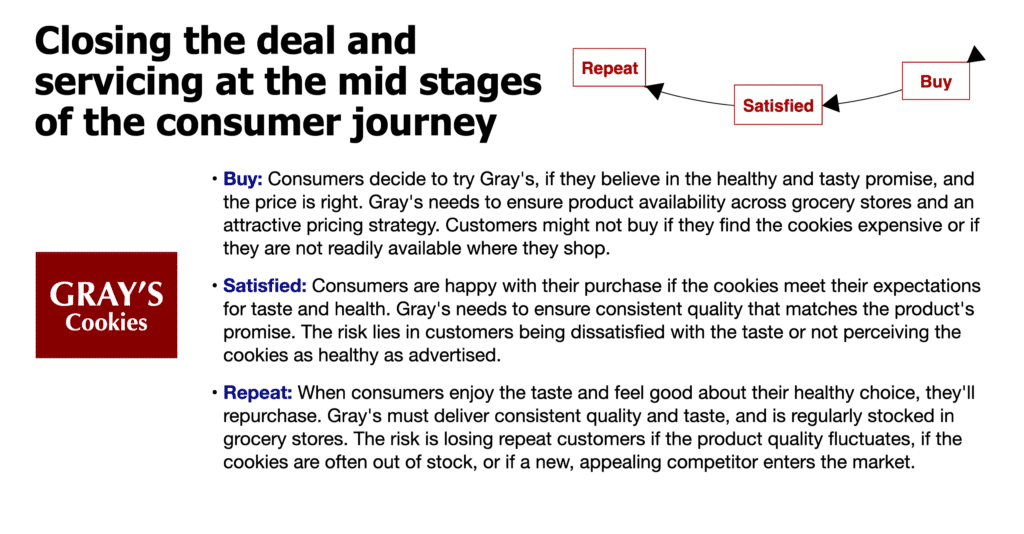
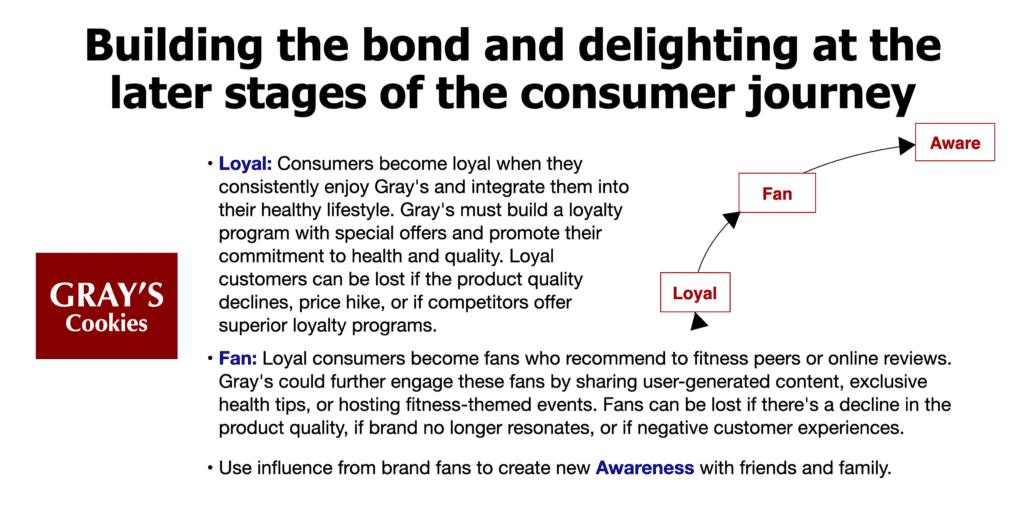
To illustrate, click on these consumer journey diagrams to see how it can impact your consumer analytics
Take your brand knowledge to new heights with our Beloved Brands playbook
Beloved Brands is a comprehensive guide that covers the fundamentals of brand management. It goes deep on strategic thinking, brand positioning, brand plan development, advertising decisions, media planning, marketing analytics, and the brand financials. This is an opportunity to build your marketing skills to help your career. And, it will provide you with the roadmap for driving growth on your brand.

Marketers see Beloved Brands playbook as a go-to resource, as they keep it within arm’s reach for any new project. We are thrilled to see that it has received a 5-star rating from nearly 90% of Amazon reviewers. Additionally, we have also created playbooks for B2B Brands and Healthcare Brands, catering to specific industries.
Use your consumer analytics to uncover the the key issues and strategies
First, take all your thinking on your brand and start organizing the best strategic questions and answers. Then, use the key issues to answer, “Why are we here?” Then, use the summary findings of the deep-dive analysis. Finally, draw out the significant issues that are in the way of achieving your stated brand vision.
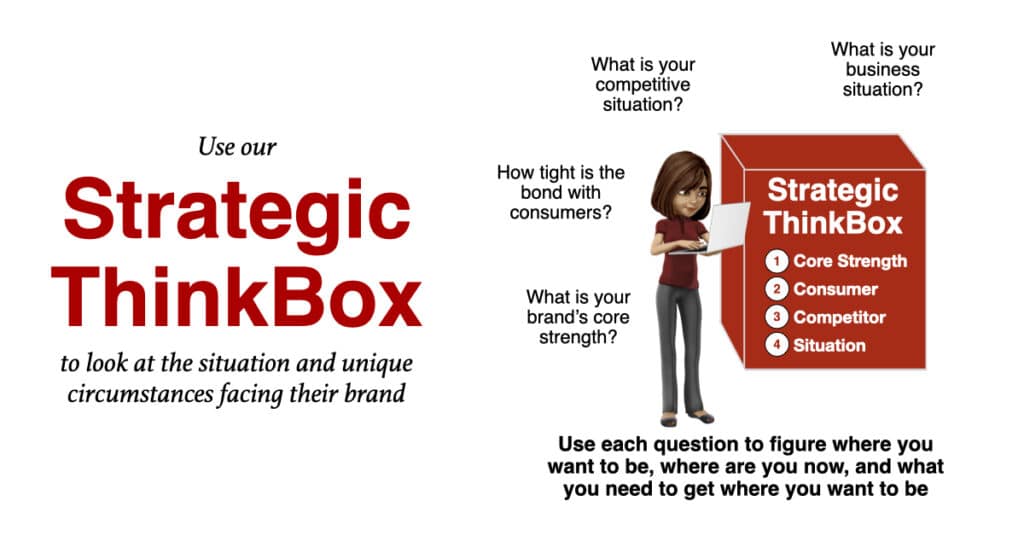
To illustrate, click on the Strategic ThinkBox that informs your strategic direction.
Our methodology for finding key issues is to use our Strategic ThinkBox with my four strategic questions model from the strategic thinking chapters. Our Strategic ThinkBox ensures you take a 360-degree view of your brand—your brand’s strength, consumer bond, competitive dynamic, and business situation.
- First, what is the core strength that will help your brand win?
- Second, how tightly connected is your consumer to your brand?
- Third, what is your current competitive position?
- Finally, what is the current business situation your brand faces?
With each of these four questions, you need to decide on your main answer and see if your investments, communications, and execution deliver on that answer. Once we have the issues expressed as questions, we can provide our strategic solutions for Gray’s Cookies.
How tight is the brand's bond with consumers?
To illustrate, how consumer analytics informs the brand love curve and consumer strategy.
Engage our brand love curve model to trigger your strategic thinking mindset. Marketers need to use consumer strategy to tighten the bond with consumers, to provide more power and set up the potential to drive added revenue and profits.
To show the differences in how consumers feel about a brand as they move through five stages, I created the brand love curve. It defines consumers’ feelings as unknown, indifferent, like it, love it and onto the beloved brand status. To read more, click on this link: How to map out your consumer strategy.
How to interrogate the consumer bond of your brand.
First, do the homework to discover how tight is the bond with your consumers. Next, we need to figure out what the underlying issues related to consumers. Here are four questions that will trigger your strategic thinking.
- First, where are you on the brand love curve. Is your brand unknown, indifferent, liked, loved, or beloved?
- Second, do you know the consumer target, knowledge, insights, match with benefits?
- Third, what triggers consumers to move along their journey?
- Finally, what does the brand funnel indicate? Penetration, frequency?
